Content
- Introduction
- What are Oversold or Overbought Stocks
- How to use Oversold or Overbought Stocks
- Tsupitero Features
Introduction
Imagine this. Bankruptcy was disclosed to the public by company XYZ. Kapag minalas ka nga naman, you are one the investors of company XYZ, as a response, you would like to dispose of all your shares right away. What would you do to sell it immediately? Sell at a lower price, right? But what if no one still wants to buy it immediately? No choice, Sell it even lower.
Read this article to know what will happen after the sell-down.
What are Oversold or Overbought Stocks
Oversold is a condition wherein the price of a particular stock sharply fell down. The reason for the decline is mainly due to the eagerness of sellers to sell their stock immediately a.k.a. panic-selling. The Oversold condition of a stock might be due to disappointing earnings, doubts in company restructuring, negative news about the company, and many other possible reasons.
On the other hand, Overbought is a condition wherein the price of a particular stock sharply goes up. The reason for the advance is mainly due to the eagerness of buyers to buy a stock immediately a.k.a. panic-buying. Panic-buying might be due to impressive earnings, confidence in company restructuring, positive news about the company, and many other possible reasons.
With the same analogy as a thermometer that measures temperature, then, what measures oversold or overbought? The Relative Strength Index (RSI), a technical indicator that measures the oversold or overbought condition of a stock, was developed by J. Welles Wilder. RSI is calculated by using a complex mathematical formula, I know.. I know.. sometimes you hate formula but don’t worry, at this time, all you need to know is how to use the value that resulted from that formula. In analogy again to a thermometer, you don’t need to know the science on how the mercury goes up to the thermometer and register a reading, you just need to know that a reading of more than 37-degree celsius is not normal.
How to use Oversold or Overbought Stocks
RSI is the technical indicator that Tsupitero.com uses to gauge the stock with an oversold or overbought condition. It is a numerical value that fluctuates from 0 to 100. Below is the screenshot of RSI in use.
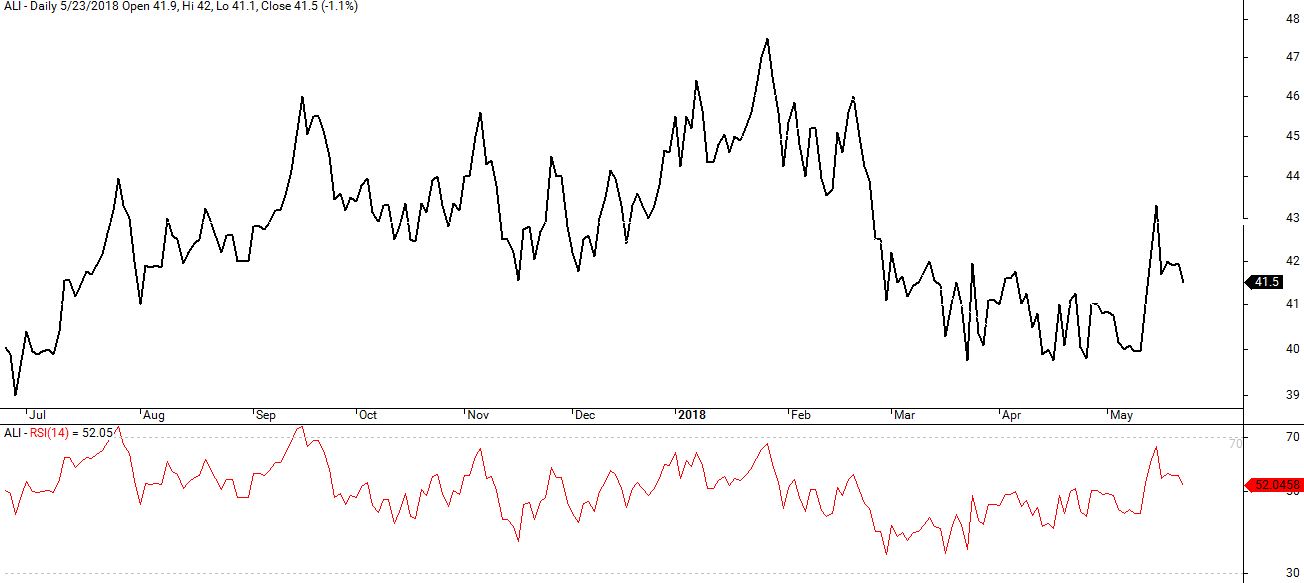
RSI (bottom red line-graph) fluctuates from 0-100. The close to zero level, the more oversold a particular stock is.
Imagine this. Bankruptcy was disclosed to the public by company XYZ. Kapag minalas ka nga naman, you are one the investors of company XYZ, as a response, you would like to dispose of all your shares right away. What would you do to sell it immediately? Sell at a lower price, right? But what if no one still wants to buy it immediately? No choice, Sell it even lower.
But that is just you. Imagine what would happen to the price of that company if all of you existing investors would sell the stock. Yep, the price would go down in a sharp way, ouch, triggering the oversold condition.
Now, after days have passed, all of you panicked investors were able to sell their shares, as a result, the price is now on its lowest level. Read again the bolded sentence and think of this:
If all the panicked investors were able to sell already (meaning, there are no panicked investors left to sell at a lower price), do you think the price would go even much lower given that there is already no one eager to sell it at a lower price?
Answer? The price will most likely not go even lower, and this is what traders call the calm after the storm, one of the best time to enter a market. Let that sink in for a while and read the paragraph again if you need to.
On the opposite side, let us imagine an overbought condition. What if all of you excited investors were able to buy the stock already? Do you think the price will still go up if everyone has already bought it? We will let your creative imagination answer the question. Or comment below! We are excited to learn from you!
By default, the RSI reading of below level 30 is an oversold condition. While for an overbought condition is when it goes above level 70.
Tsupitero Basic Feature
If you have your own charting tool, you can just simply load the RSI and manually press the up-down button to look for the oversold or overbought stock. Simple as that, but doing this 300 times? Mmm, perhaps a time-consuming method. And that is where Tsupitero.com comes in, with just a few clicks, you can already see which stock is oversold or overbought. And that’s not all, you can also view it by category. Yep! Simple as that.
Now, you have choices, to begin with. The actual step in using this tsupitero feature can be found below.
Premium Feature
In calculating the value for RSI, there is a parameter that we call as time period. By default, it has a value of 14. With Tsupitero Premium, you can replace it with any value you want, suited for the trading style you need. Do you have any suggestions in your mind? Comment below! There are many benefits of a premium user, be sure to read other blogs to learn more. Register Today!

